Other techniques:
This technique is particularly useful for testing systems that have many different behavior variants depending on input conditions. It helps identify important scenarios and minimizes the number of tests needed to cover all possible variants. The Classification Tree is most commonly used for generating sets of Smoke tests, which are the minimal set of scenarios.
It is important to understand that creating and properly using a classification tree requires a thorough knowledge of the application's domain and the ability to identify key inputs and their combinations to ensure the testing is as effective as possible.
Key points of the Classification Tree technique are:
- Identification of inputs: First, identify the inputs or conditions that affect the system's behavior. These conditions are then structured into a tree model.
- Tree creation: Based on the inputs and their combinations, a tree structure is created where the branches of the tree are represented by different combinations of input conditions.
- Generation of test scenarios: The classification tree is then used to identify relevant test scenarios. These scenarios can be used to test various input options and verify if the system responds correctly as expected.
- Testing Efficiency The goal is to cover all possible combinations of input conditions with the least number of test scenarios, thereby minimizing the number of tests while ensuring thorough coverage of the system's functions.
-
TESTONA Light
- + Here you can directly design a classification tree.
- + Nice visual outputs, suitable for presentations.
- - Needs to be downloaded.
- - The free version can only handle simple trees.
-
Draw.io
- + Online, can be saved on Git, Dropbox, Google Drive, etc.
- + Customizable for any visual requirements.
- + Can create many other diagrams.
- - Needs to be created manually, similar to a mind map.
For Draw.io, you can use our Classification Tree template template.drawio (25kB) Download
Free tools suitable for Classification Tree:
How to create a proper Classification Tree?
First, correctly identify the variables and the values they can take. Write them all down next to each other, and for each variable, make a dot under the first value. Then under the second, third, and so on until each value has been represented at least once. If a variable has fewer values than another, start again from the first value for that variable. See the image.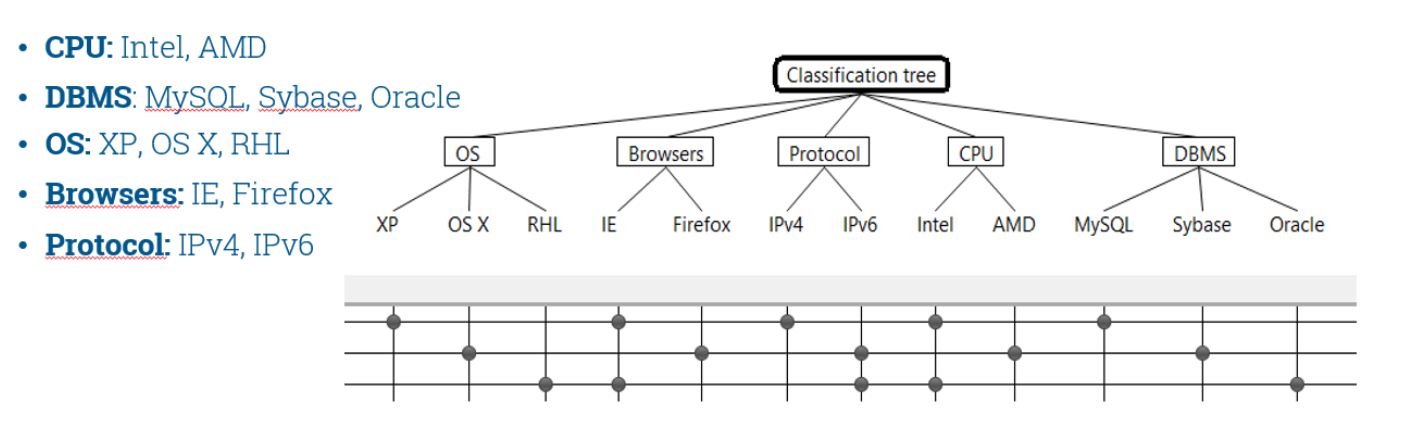
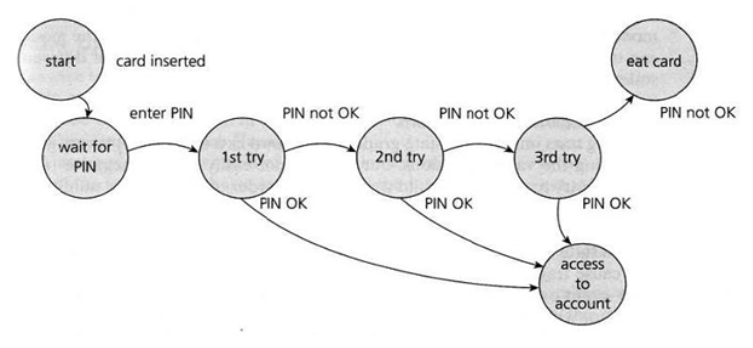
TThe State Transition technique is a method of modeling system behavior used to describe the various states a system can be in and the transitions between these states. This technique is often used in software engineering to specify and test the behavior of programs and systems with interactive or dynamic characteristics.
A state transition diagram is a graphical tool used to visualize system states and transitions between them.
- Each state of the automaton.
- Each transition of the automaton.
- Every possible sequence of transitions.
Tests are created for:
- State Diagram Maker (Creately)
-
Draw.io
- + Online, can be saved on Git, Dropbox, Google Drive, etc.
- + Customizable for any visual requirements.
- + Can create many other diagrams.
- - Needs to be created manually, similar to a mind map.
Free tools suitable for State Transition:
Example – Entering a PIN at an ATM:
Boundary value analysis is a testing technique used to identify errors at the boundary values of input data. This technique is often used to minimize errors due to unexpected input values. When creating test scenarios using BVA, boundary values between individual categories of input data are examined, including minimum and maximum values and transitions between them. This analysis helps uncover possible errors in handling inputs that could lead to non-functional or incorrect system results.
The BVA technique is most commonly used in combination with the EVP technique, see below.
Example:
If the establishment of a specific product is only possible from the age of 18, then the boundary is between 17 and 18 years (i.e., the day before the 18th birthday and the day of the 18th birthday). If N = birthday, then the boundary values and their neighboring values would look like this:
| N - 2 | N - 1 | N |
|---|
| N - 1 | N | N + 1 |
|---|
- 2 days before the birthday
- 1 day before the birthday
- the birthday
- 1 day after the birthday
So, the boundary values would be four:
Equivalence Partitioning is a testing technique used to reduce the number of test scenarios by dividing input data into equivalent classes or groups. This technique is often used to test different values of input data without having to test every possible value separately.
When creating test scenarios using EVP, input data is divided into groups so that all data in one group has similar behavior or system response. This approach allows testing one representative from each group, effectively covering different system behavior variants and minimizing the need to test every possible combination of inputs.
The EVP technique is most commonly used in combination with the BVA technique, see above.
Example:
- 0.
- 1.-28.
- 29/30/31 (depending on the month)
- 32.+
For testing dates in a calendar month, there will be four groups of values: